
Note: This is an automated translation (using DeepL) of the original German article.
Daily numbers of reported cases are bouncing up and down. The 7-day average brings stability and overview.
Currently, the number of daily new infections (tested positive) is used as an indicator for the COVID-19 epidemic. However, this number has its pitfalls and weaknesses (see [The fluctuating number of new cases](/blog/covid-19-the-fluctuating number of new cases)).
The number of positive test results is subject to system, date, weather and statistical fluctuations. On the one hand, because not the same number of infections occur every day. Special days (Halloween, last day before the 2nd lockdown, first shopping Saturday), weekdays (Saturdays I meet friends) or the weather (it’s pouring, today I’m not going anywhere) have an influence on the number of infections. The time between infection and positive test result also varies from person to person. And since the laboratories cannot evaluate the same number of tests every day (especially not on weekends, when some of the staff are off) and the IT system can also have breakdowns, the test results are not recorded evenly in the system. Due to these influences it is therefore only possible to compare consecutive days to a limited extent.
An elegant solution to this problem is to calculate an average value.
The influence of chance, also known as statistical fluctuation, balances itself out in the long run. If you toss a coin 3 times, only heads (i.e. three times) occur relatively regularly (statistically about once in eight 3 attempts). But if you flip a coin 300 times, the number of heads is expected to be between 130 and 170 - relatively close to the average of 150.
Since in COVID-19 new infections the weekday plays an important role both for the infection (working day and weekend) and for the diagnosis, i.e. the evaluation of the tests (fewer laboratory personnel at the weekend), it makes sense to take an average over a whole week. This means that each weekday is included only once, regardless of whether the average is formed by Mon-Sun or Fri-Thu.
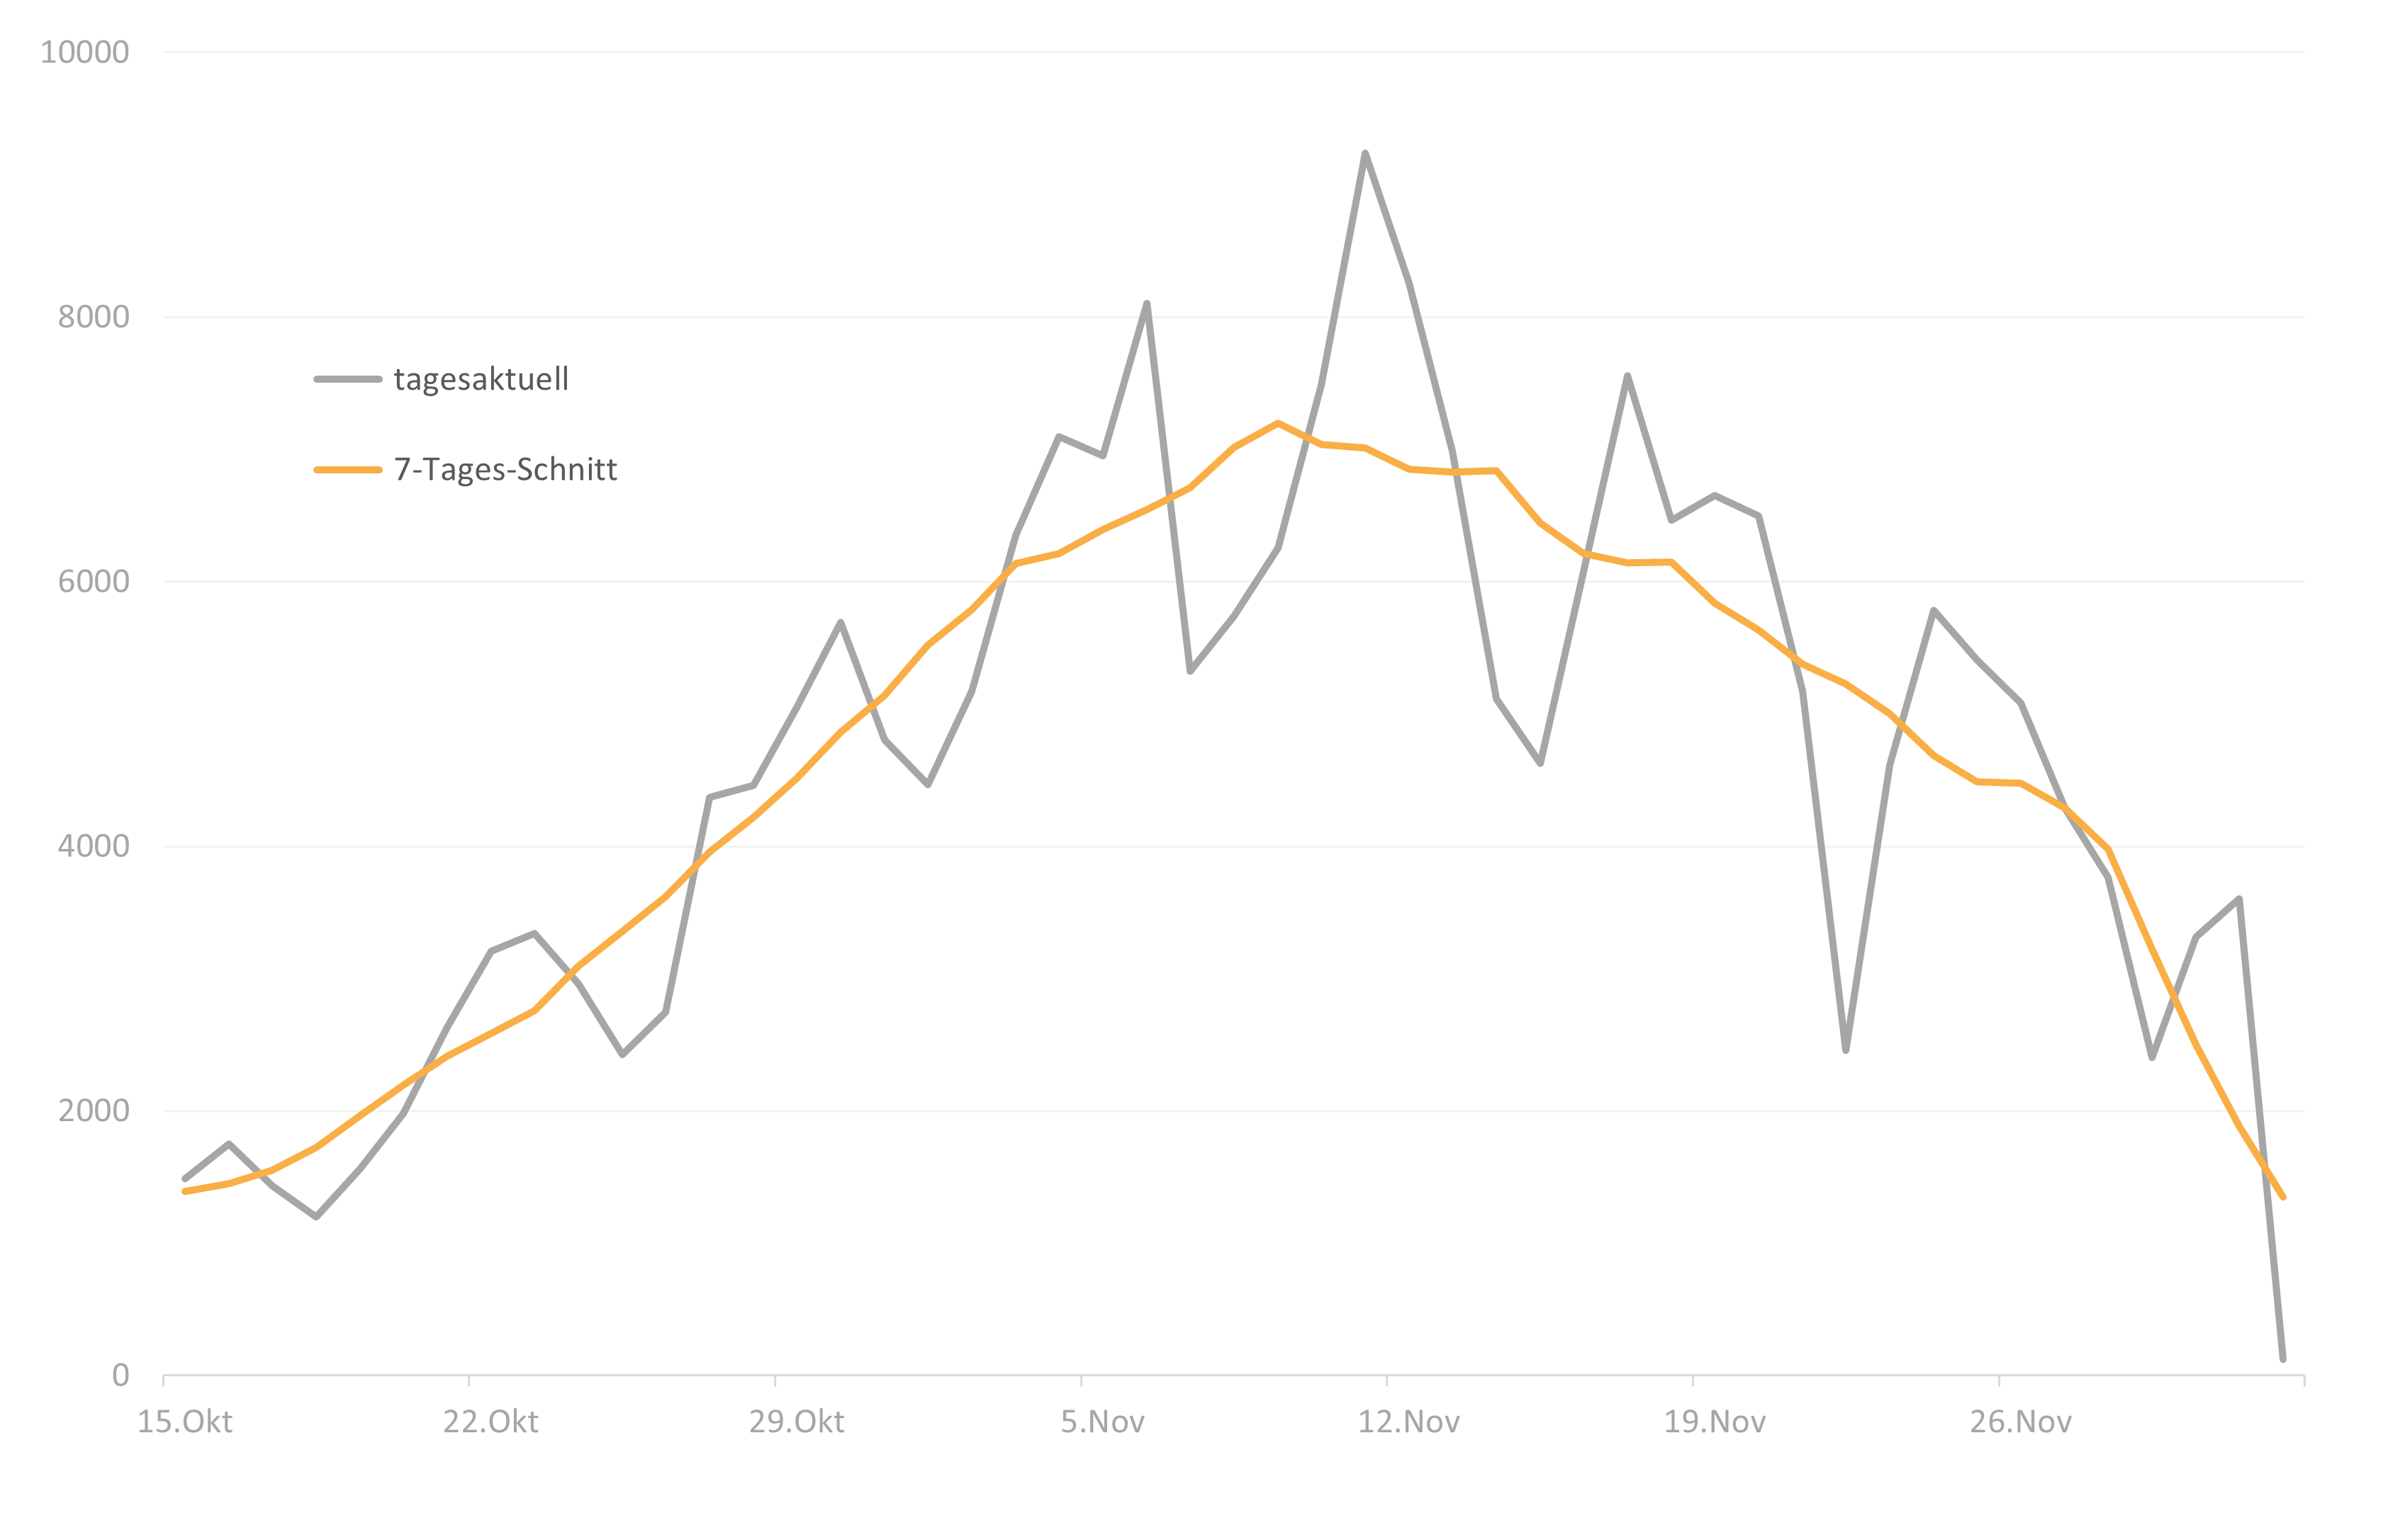
As with the coin toss, the “random” effects are smoothed out by the longer observation period of one week. This average value (orange line) in the graph) has the advantage that it is much more stable and meaningful than a random daily value (grey line).
A stable value is especially recommended as a basis for decision-making. Since it takes a good week to observe the effects of measures anyway, there is no disadvantage due to the minimal delay. On the contrary: due to the better comparability, a trend can be recognized much more precisely than with daily jumping values.
Remark: Of course, a 7-day average does have one disadvantage: both media and decision makers have less to report, because it is more stable and therefore changes less spectacularly.