Note: This is an automated translation (using DeepL) of the original German article.
Non-collectable figures, estimated by simulation modell, allow for better understanding of pandemic dynamics
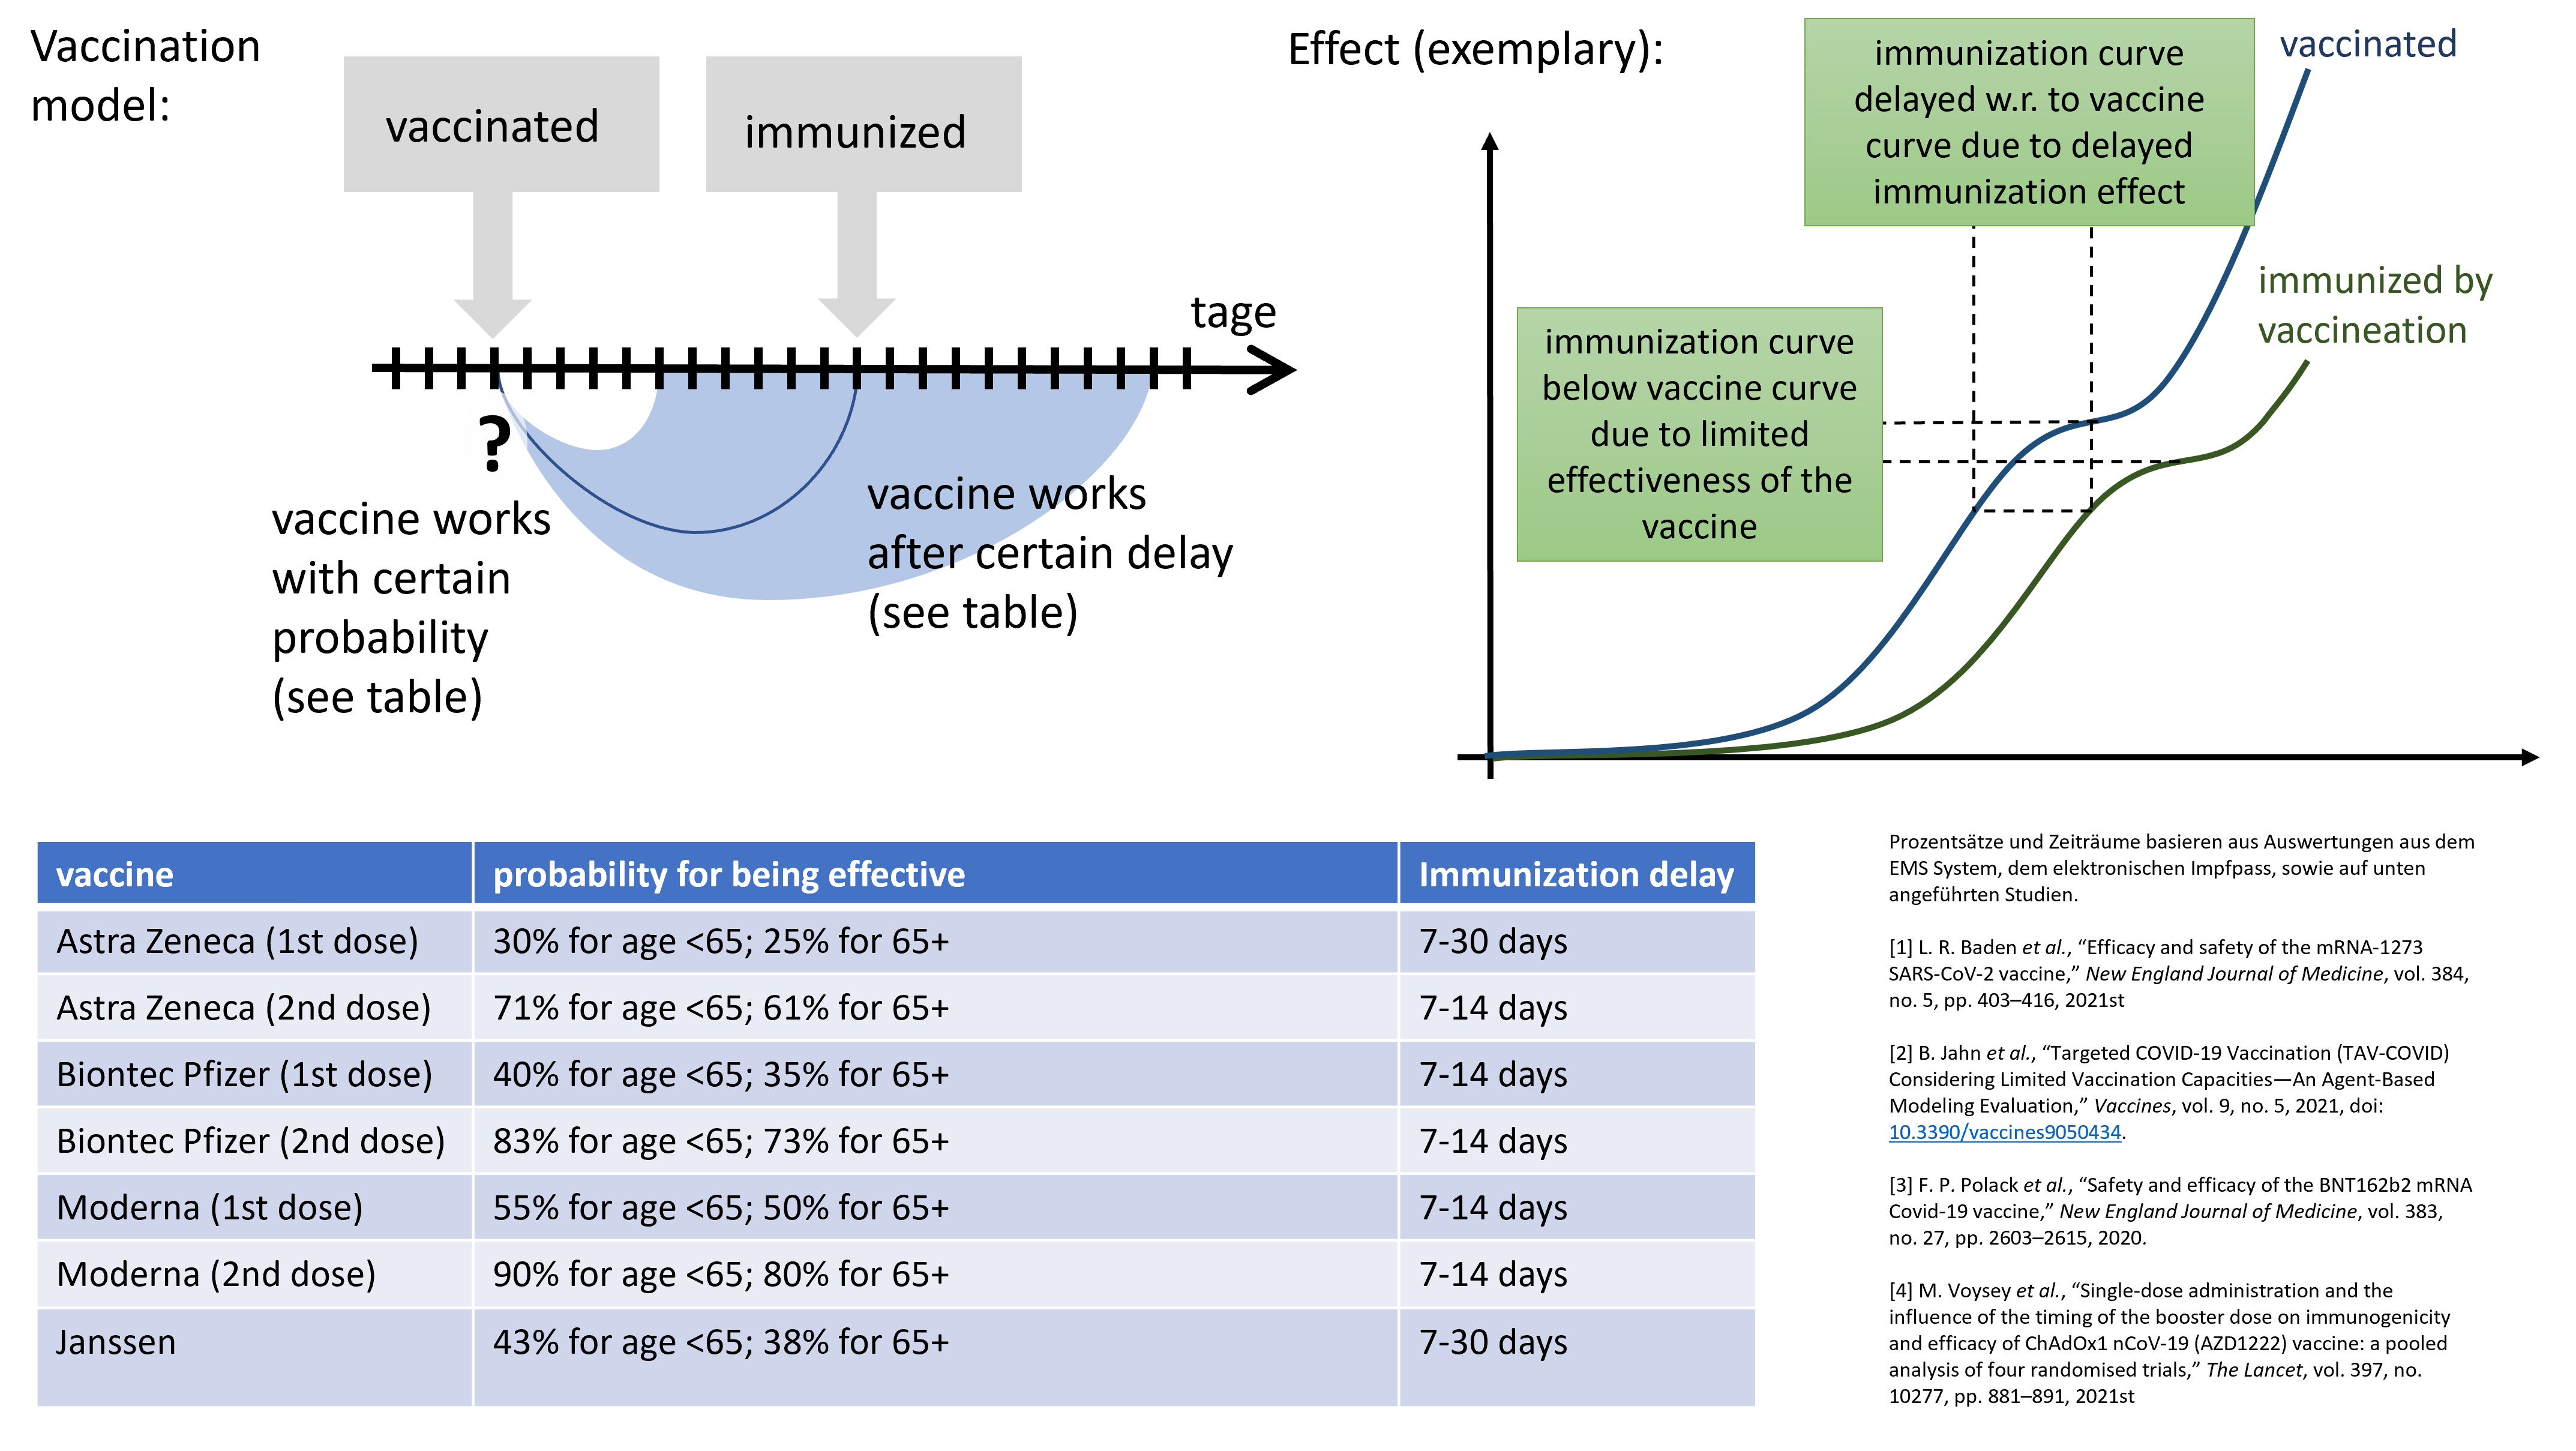
The major challenge in assessing the COVID-19 situation is that much necessary information and data is not available. On the one hand, this is due to organizational reasons (among others, data are not consistently collected and merged): this concerns, for example, the linkage of data on the severity of diseases or previous illnesses to vaccination status. Second, it is due to the nature of the disease itself. For example, asymptomatic disease is only recorded if the affected person is tested (by chance) at the right time. The same is true for immunity; vaccination protects very reliably, but just not 100% of vaccinated persons. In addition, people who have been vaccinated or have recovered also lose their immunity after a certain time.
For a well-founded assessment of the situation and, above all, to be able to estimate the further dynamics, it is important to understand how many people are currently still infectious and how many are not. Together with other data, such as measures taken, data on the virus, existing test programs, but also the current weather situation and mobility, a forecast can be made. For this purpose, all available information and data are combined. With the help of the simulation model, in which all (almost) 9 million Austrians are represented as “digital doubles”, the actual situation can then be calculated realistically. For immunization, this shows that there are strong differences between the data (recovered and vaccinated persons) and those who are actually immunized.
The following diagram is updated regularly to show the current status of these data and correlations.
Data as of November 1st, 2021.
Summary
Theoretically, it is easy to calculate how many people in Austria are neither vaccinated nor recovered. In the Epidemiological Reporting System (EMS) all confirmed cases of disease are documented and from the vaccination program we know the number of partially and fully vaccinated people. The difference to the total population is therefore the “visible” proportion of unprotected persons (left bar). However, this number does not take into account the undetected survived diseases (asymptomatic cases). However, with the help of the computer model, this can be calculated. Subtracting this number, the number of at-risk/unimmunized individuals appears (significantly) better (middle bar).
But even this perspective is not complete. For it does not take into account the loss of immunity. After all, recovered people lose their (natural) immunization after a certain time. And with vaccination, there is also no 100% protection, or this protection must also be renewed. Taking these effects into account, it can be seen that there are significantly more non-immunized people.
| Modeling of persons neither confirmed recovered nor immunized by vaccination - without dark rate based on real data 11/1/2021 | Modeling including dark rate (unconfirmed recovered) based on real data 11/1/2021 | Modeling of actual immunization. |
|---|
Hold the mouse over a bar to get more information. Click on the legend to hide & show parts.
The right bar is grouped as follows:
- Vaccinated with loss of immunity:
- Fully vaccinated
- Partially vaccinated
- Unconfirmed recovered with loss of immunity:
- Unconfirmed recovered
- Unconfirmed recovered + fully vaccinated
- Unconfirmed recovered + partially vaccinated
- Recovered with loss of immunity:
- Recovered
- Recovered + fully vaccinated
- Recovered + partially vaccinated
In detail
On the left side are vaccination progress and recoveries based on official data. So how many people in Austria are currently …
- recovered (blue)
- partially vaccinated (blue)
- fully vaccinated (green)
- recovered and partially vaccinated (green)
- recovered and fully vaccinated (green), or
- neither (red).
The vaccinated people are divided into partially vaccinated, fully vaccinated and recovered and partially or fully vaccinated. It should be noted that the time lag of the vaccination is already included here, i.e. the figures are not directly comparable with the vaccination figures.
| modeling without dark rate based on real data 11/01/2021 | modeling including dark rate based on real data 11/01/2021 | modeling of effective immunization in the population |
|---|---|---|
| Calibration approximates real data* as closely as possible and takes the view of the health care system, i.e. only identified cases are represented. | In the same model, the view is taken that the modeled overall dynamics are fully known. People have at least one contact with virus and/or vaccination in the model. | Due to lack of vaccine efficacy, partial loss of immunity over time and other effects modeled “real immunization” with full protection |
*Real data 11/01/2021 incl. delay of vaccination efficacy based on (http://www.dexhelpp.at/site/assets/files/2311/impfmodell_3.png): partially vaccinated 2.0%, fully vaccinated 58.1%, not vaccinated, not recovered 30.4%, recovered & fully vaccinated 3.3%, recovered & partially vaccinated 1.5%, recovered 4.7%, BMSGPK.
)
Hold the mouse over a point to get more information. You can also move and rearrange the bars.
In the middle axis, the unconfirmed cases of disease (dark figure) are additionally taken into account. This increases the number of people who have already developed immunity through contact with the virus and/or vaccination.
This intersection of the recorded numbers (vaccinations & recoveries) with the dark figure based on different antibody studies and published data is possible through the model calculation on the virtual population. The “dark rate groups” break down into people who have had an unconfirmed illness and are either fully vaccinated, partially vaccinated, or non-vaccinated.
But…
How many people are fully immunized is shown on the far right. This does not mean how many people are doubly vaccinated, but it is the number of people who are truly protected against infection in the virtual world. To do this, the loss of immunity must be taken into account, as well as limitations on vaccine effectiveness. In the computer model, the epidemic progression in the virtual population is simulated with the data from the vaccination program, studies (including vaccination protection see e.g. http://www.dexhelpp.at/site/assets/files/2311/impfmodell_3.png or loss of immunity) or other modeling (including loss of immunity https://www.tuwien.at/tu-wien/aktuelles/news/news/covid-19-modellrechnungen-genesene-bleiben-lange-geschuetzt ).
These data show the modeled actual state for the effective immunity of the Austrian population (right axis of the graph). Taking into account the loss of immunity, the non-100% effectiveness of vaccination and other effects, the proportion of individuals with full immunity is between 60% and 65%. Especially in the groups partially vaccinated, unconfirmed recovered and fully vaccinated there are many people who have no or only reduced immunity or have already lost it again - at least partially. Explanations for this are that the vaccination or recovery was already (too) long ago, that a partial vaccination only protects inadequately, and that the vaccination protection does not reach 100%.
This “retrospective” modeling thus allows us to classify where we stand. 60-65% percent are effectively immunized according to the current model status and are no longer infectious (in the simplified model world). They currently represent a human “barrier” to the simulated viruses.
Based on these results, together with modeled vaccination strategies, “prospective” scenarios can now be calculated. In a current estimate, we assume that a proportion of about 80% immunized individuals is necessary to keep the spread of SARS-CoV-2 in check by immunity alone (apart from sensible hygiene measures, which are also sensible for other infectious diseases). In the absence of hard epidemiological measures (lockdowns or similar), this level will be achieved either by an appropriate number of illnesses or vaccinations. From a societal point of view, the vaccination approach is much more desirable, as it avoids direct (illness and death) and indirect (collateral damage due to overloading of the health care system) human suffering.