
Note: This is an automated translation (using DeepL) of the original German article.
How the virtual population model helps review and improve knowledge on immunization and vaccine effectiveness
With the availability of new data on the relationship between vaccinations and diseases, the virtual population model of TU Wien, DEXHELPP and dwh GmbH can help to even better estimate the current immunity in Austria and to simulate future developments depending on vaccination progress. This will allow better decisions e.g. for “xG” regulations.
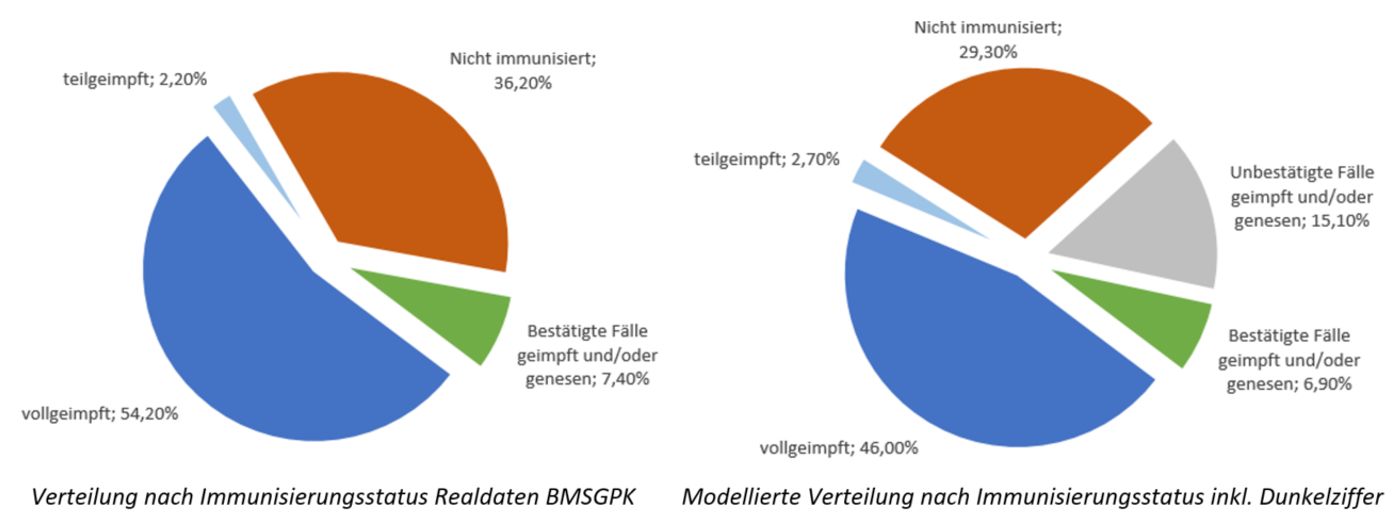
Currently, we assume that there are more than 15% of unconfirmed cases. This has a correspondingly strong impact on the proportions of immunized groups. Thus, currently almost 30% of Austrians are likely to be unprotected. The model shows that immunization after recovery is currently underestimated. The effect of initial vaccination is considered to be low because of the spread of the delta variant. Moreover, the incidence in the non-immunized group (neither vaccinated nor recovered) is likely to be as much as about 20% higher according to model results than real data show.
The studies currently suggest that immunization persists for only a certain time after surviving SARS-CoV-2 infection. They also show that vaccination does not provide complete protection against infection in all cases. These data are incorporated into our model. Duration and effectiveness of immunization are critical parameters in this model. We can analyze and greatly improve these parameters using the new data now available.
Thus, on the one hand, scenarios and forecasts can be further improved. On the other hand, the parameters on immune loss and vaccination effectiveness in the virtual population of the model can be adjusted to correctly reflect the current dynamics in Austria. These parameters will then be made available to other research groups to compare with other studies.
In a recent working paper, incidence rates are modeled for population groups by immunization status. The model shows that currently just over 70% have been vaccinated at least once and/or recovered from the disease, with about 15% of these being unconfirmed cases (unreported cases) (as of 8/20/2021).
By comparing the real data from the federal ministry and the simulation results, it is now possible to test hypotheses about the effectiveness of different immunization progress and loss of immunity.
Evaluation of the real data
When evaluating the 7-day incidence, i.e., how many newly confirmed SARS-CoV-2 infections there were per 100,000 people within the last seven days, the following picture emerges for the respective population groups.
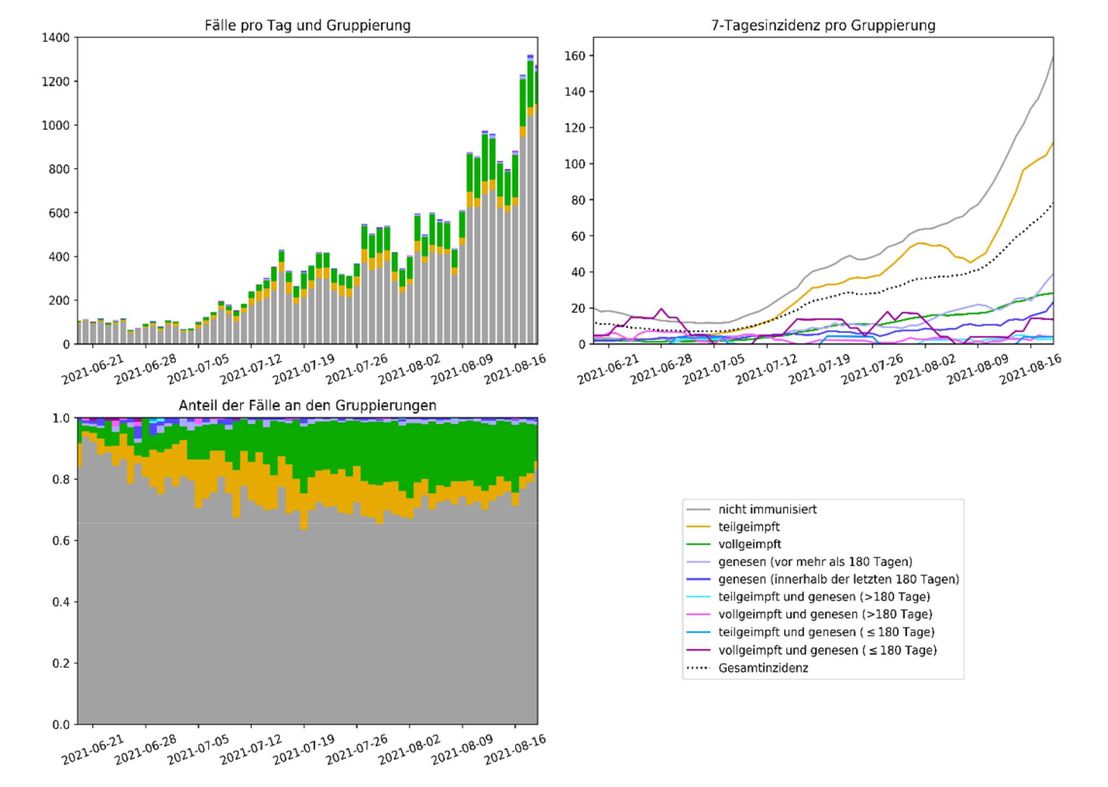
Compared with the general 7-day incidence, which is about 81 as of Aug. 20, the group-specific incidence is almost twice as high in the “non-recovered and non-vaccinated” group. This means that out of 100,000 people in this group, a total of about 160 contracted the virus within the last week. In comparison, the incidence among the fully vaccinated is about 27, about one-sixth that of the first group. Recovered individuals are in about the same range as fully vaccinated individuals.
Evaluation of the model results
In contrast to the real data, the model also takes into account the number of unreported cases. A different picture emerges for the 7-day incidence of the individual groups.
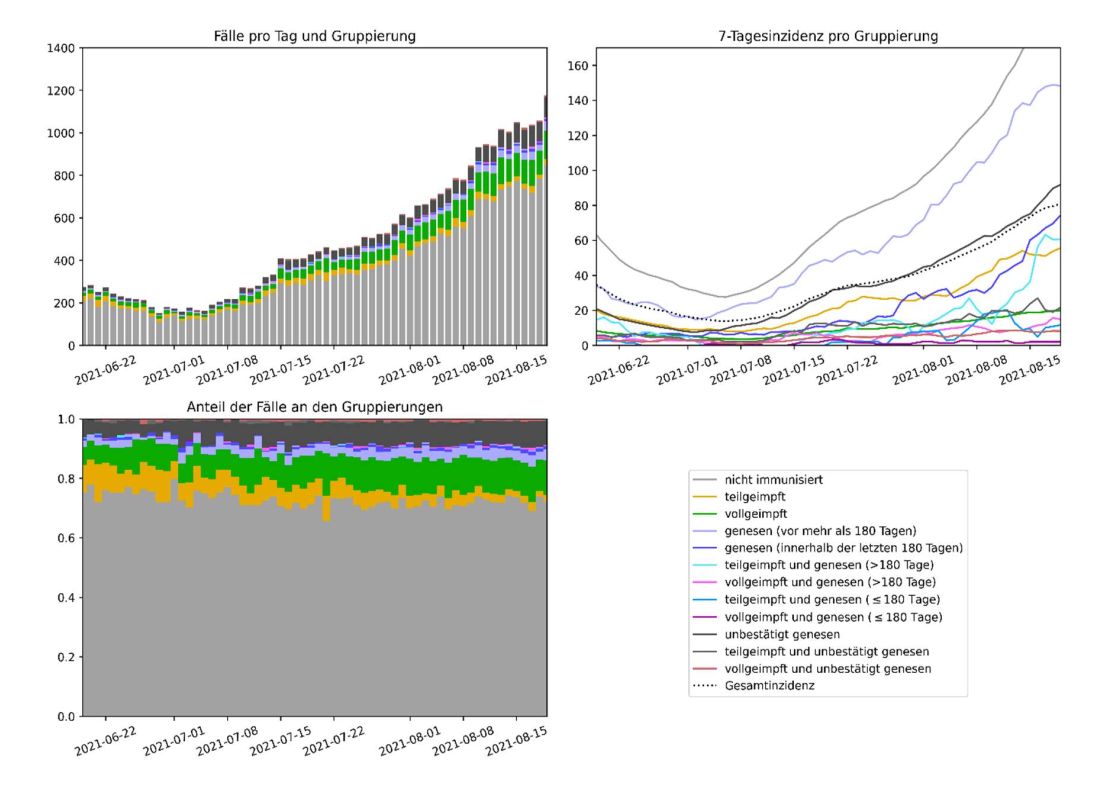
Here, partial immunes and convalescents have virtually exchanged places. In contrast to the real numbers, in the model a (confirmed) experienced infection provides significantly worse protection. For those recovered within the last 180 days, the incidence measured in the observational data is slightly above 20 (as of 8/20/2021). In the model, however, the value is just under 80, almost as high as the overall incidence. For people with recovery longer than 180 days ago, the incidence in the real data is about 40, but in the model - corresponding to the modeled rapid loss of immunity - it is almost 150 and thus not particularly far below the value for non-immunized people.
Classification of differences
In the model, one loses protection from infection on average 180 days after recovery. The above observation now allows us to better parameterize the loss of immunity after experienced infection. It suggests that the current assumptions here may be too conservative or too stringent. Based on these results, one could discuss classifying recovery more positively in access regimens.
A second interesting aspect is the effectiveness of partial vaccination in the model. This is clearly too good based on the studies in the model compared to the real data. In the real data, the incidence for the partially vaccinated group is over 100. In the model, the comparative value is not even 60. This is due to the fact that the assumptions on vaccination effectiveness underlying the model are based on manufacturer studies, which are now obviously no longer valid to this extent with the Delta variant.
Another interesting aspect is that in the model the unconfirmed cases can be separated from the group of the “non-vaccinated”. This leads to the effect that the group-specific incidence of the non-vaccinated and non-recovered (real data 20.8.2021: approx. 160) shoots up even further (on 20.8.2021 already almost 200) than they were in the observed data. This result shows how much the current spread is taking place among non-immunized people.
The model will now be used to simulate updated hypotheses and compare them with current studies to generate conclusions about vaccination effectiveness in the current Austrian epidemiological situation.
Download
Here you can download the whole related working paper.