
Note: This is an automated translation (using DeepL) of the original German article.
An assessment by the COVID-19 simulation team for guidance and explanation of the current forecasts
Current forecasts and scenarios on Omicron
Data and current forecast show, the increase in daily caseload as well as 7-day average is - as expected - high. At the same time, however, we also try to work up the evidence on how many people become seriously ill, how international studies “match” Austrian data, why the situation is so dynamic due to a “relapse” in effective immunity against infections, or what impact quarantine regulations (can) have. This and other aspects will be critical to the current steps.
Current forecast as of 4/1/2022
Today, the current COVID-19 forecast from the forecast consortium (with the collaboration of DEXHELPP and dwh GmbH) was published. The highly accelerated infection event already predicted before Christmas due to the dominance of the Omicron variant has begun and will now continue. Details can be found in the forecast. Within the forecast horizon, this will also lead to an increase in the normal care burden in hospitals.
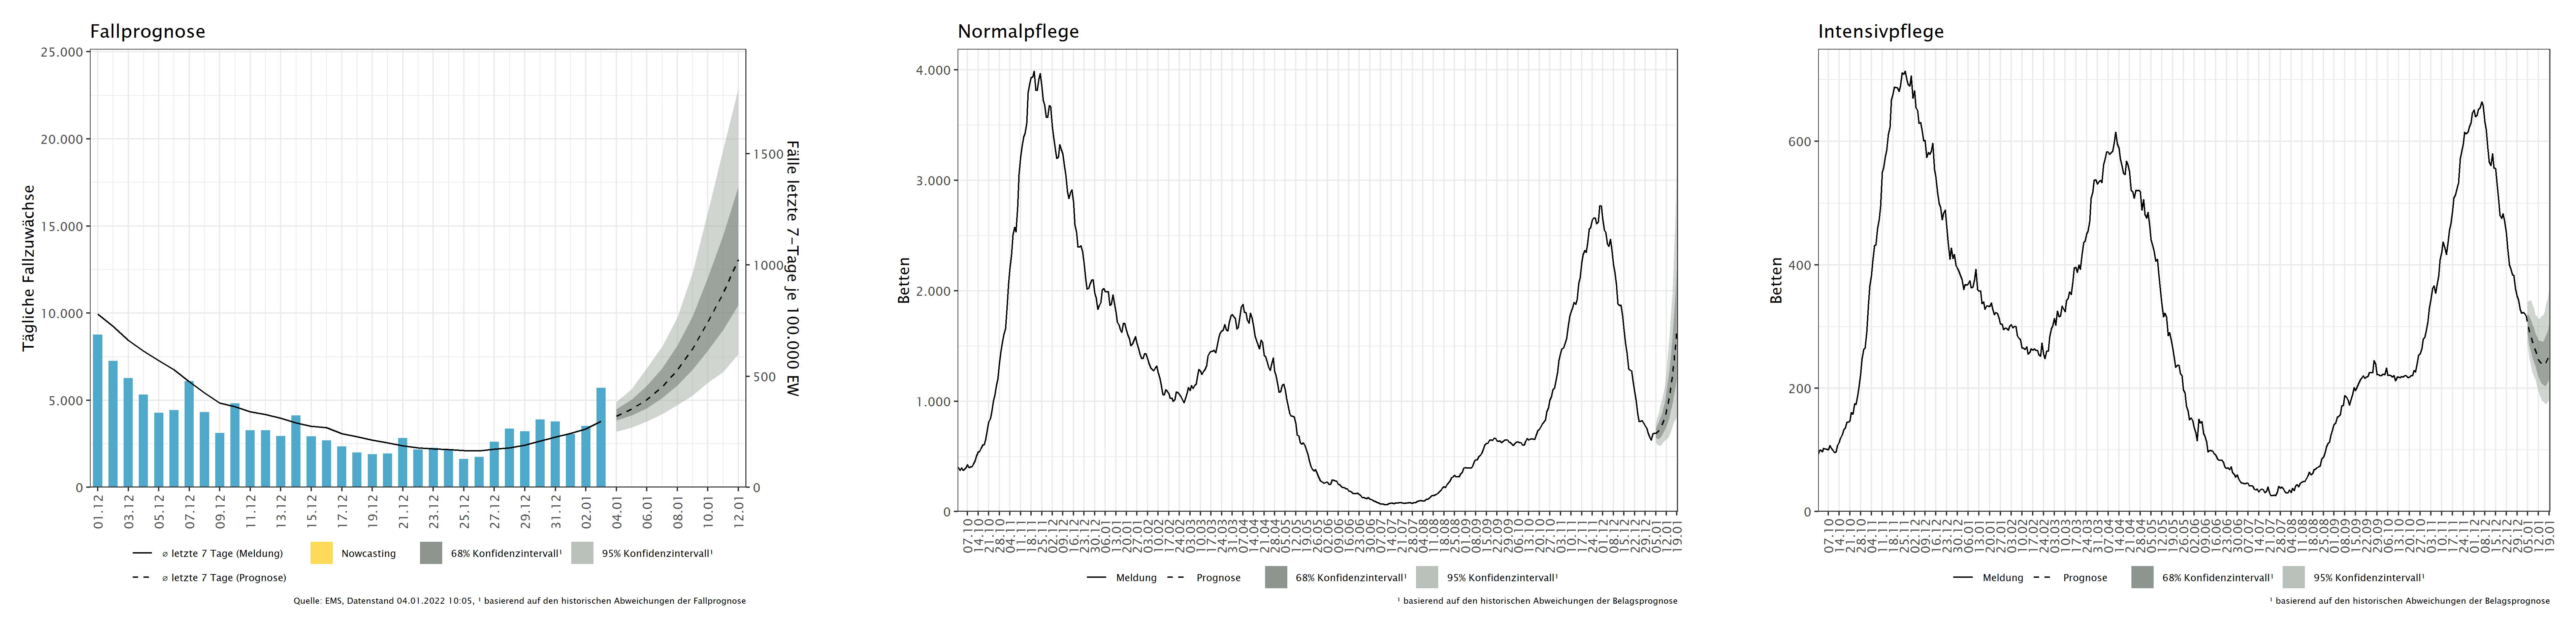 Figure 1: Forecast Consortium projections for (from left to right) number of daily case growths, necessary normal care beds, and ICU beds (click here for a larger image).
Modeling of the spread dynamics has been possible for one to two weeks with relative certainty. Data from Denmark, South Africa and other countries are available. However, it is still relatively difficult to say how severely people will become ill as a result of the Omicron variant. Although good data suggest that Omicron leads to weaker courses, especially in vaccinated and recovered people. Nevertheless, the coating prognosis in particular should be interpreted with caution.
What are the bases used in the current Omicron models - what changes?
In our model, we use the Technical Briefings of Imperial College London (as of December 31, see [1],[2]) as the basis for hospitalization rates. From these, we adopted the following values as model assumptions:
- Hospitalization rates for more than 1-day stays are reduced by about 40% compared with Delta - this is true for all patients, including the unvaccinated. Accordingly, vaccinated and recovered patients have an even lower probability of a severe course.
- The situation is different for protection against infections: the protective effect is greatly reduced compared to the delta variant. Recovered and 1x vaccinated persons have hardly any protection against reinfection, while the protection for 2x vaccinated persons is reduced by about 66% and for boostered persons by about 20%.
- As with protection against the delta variant, this also decreases over time.
- For symptomatic infections, the risk of hospitalization, compared to unvaccinated (and non-recovered), is reduced by 35% for 1-dose vaccination, 51% for 2-doses, and 68% for 3-doses.
- Convalescents are assumed to have a 60% reduced risk of hospitalization according to this study.
- The protection against hospitalization of positively tested triple vaccinated persons is thus 68%.
- Overall, the hospitalization rate of boostered persons is reduced by about 90% compared to unvaccinated persons.
It is currently (still) difficult to determine how high the proportion of people requiring intensive medical care is: here the values vary between “no significant improvement” and a “strong reduction to one fifth”.
Overall, these assumptions lead to an increase in hospitalization; with regard to the utilization of intensive care beds, no effect is yet to be expected in the forecast period mentioned.
Currently, the information situation is developing further every day as a result of new studies. As a result, we sometimes make slightly divergent assumptions in different scenarios. The exact assumptions are therefore indicated in each case for the specific scenarios and analyses.
Validate data and parameters
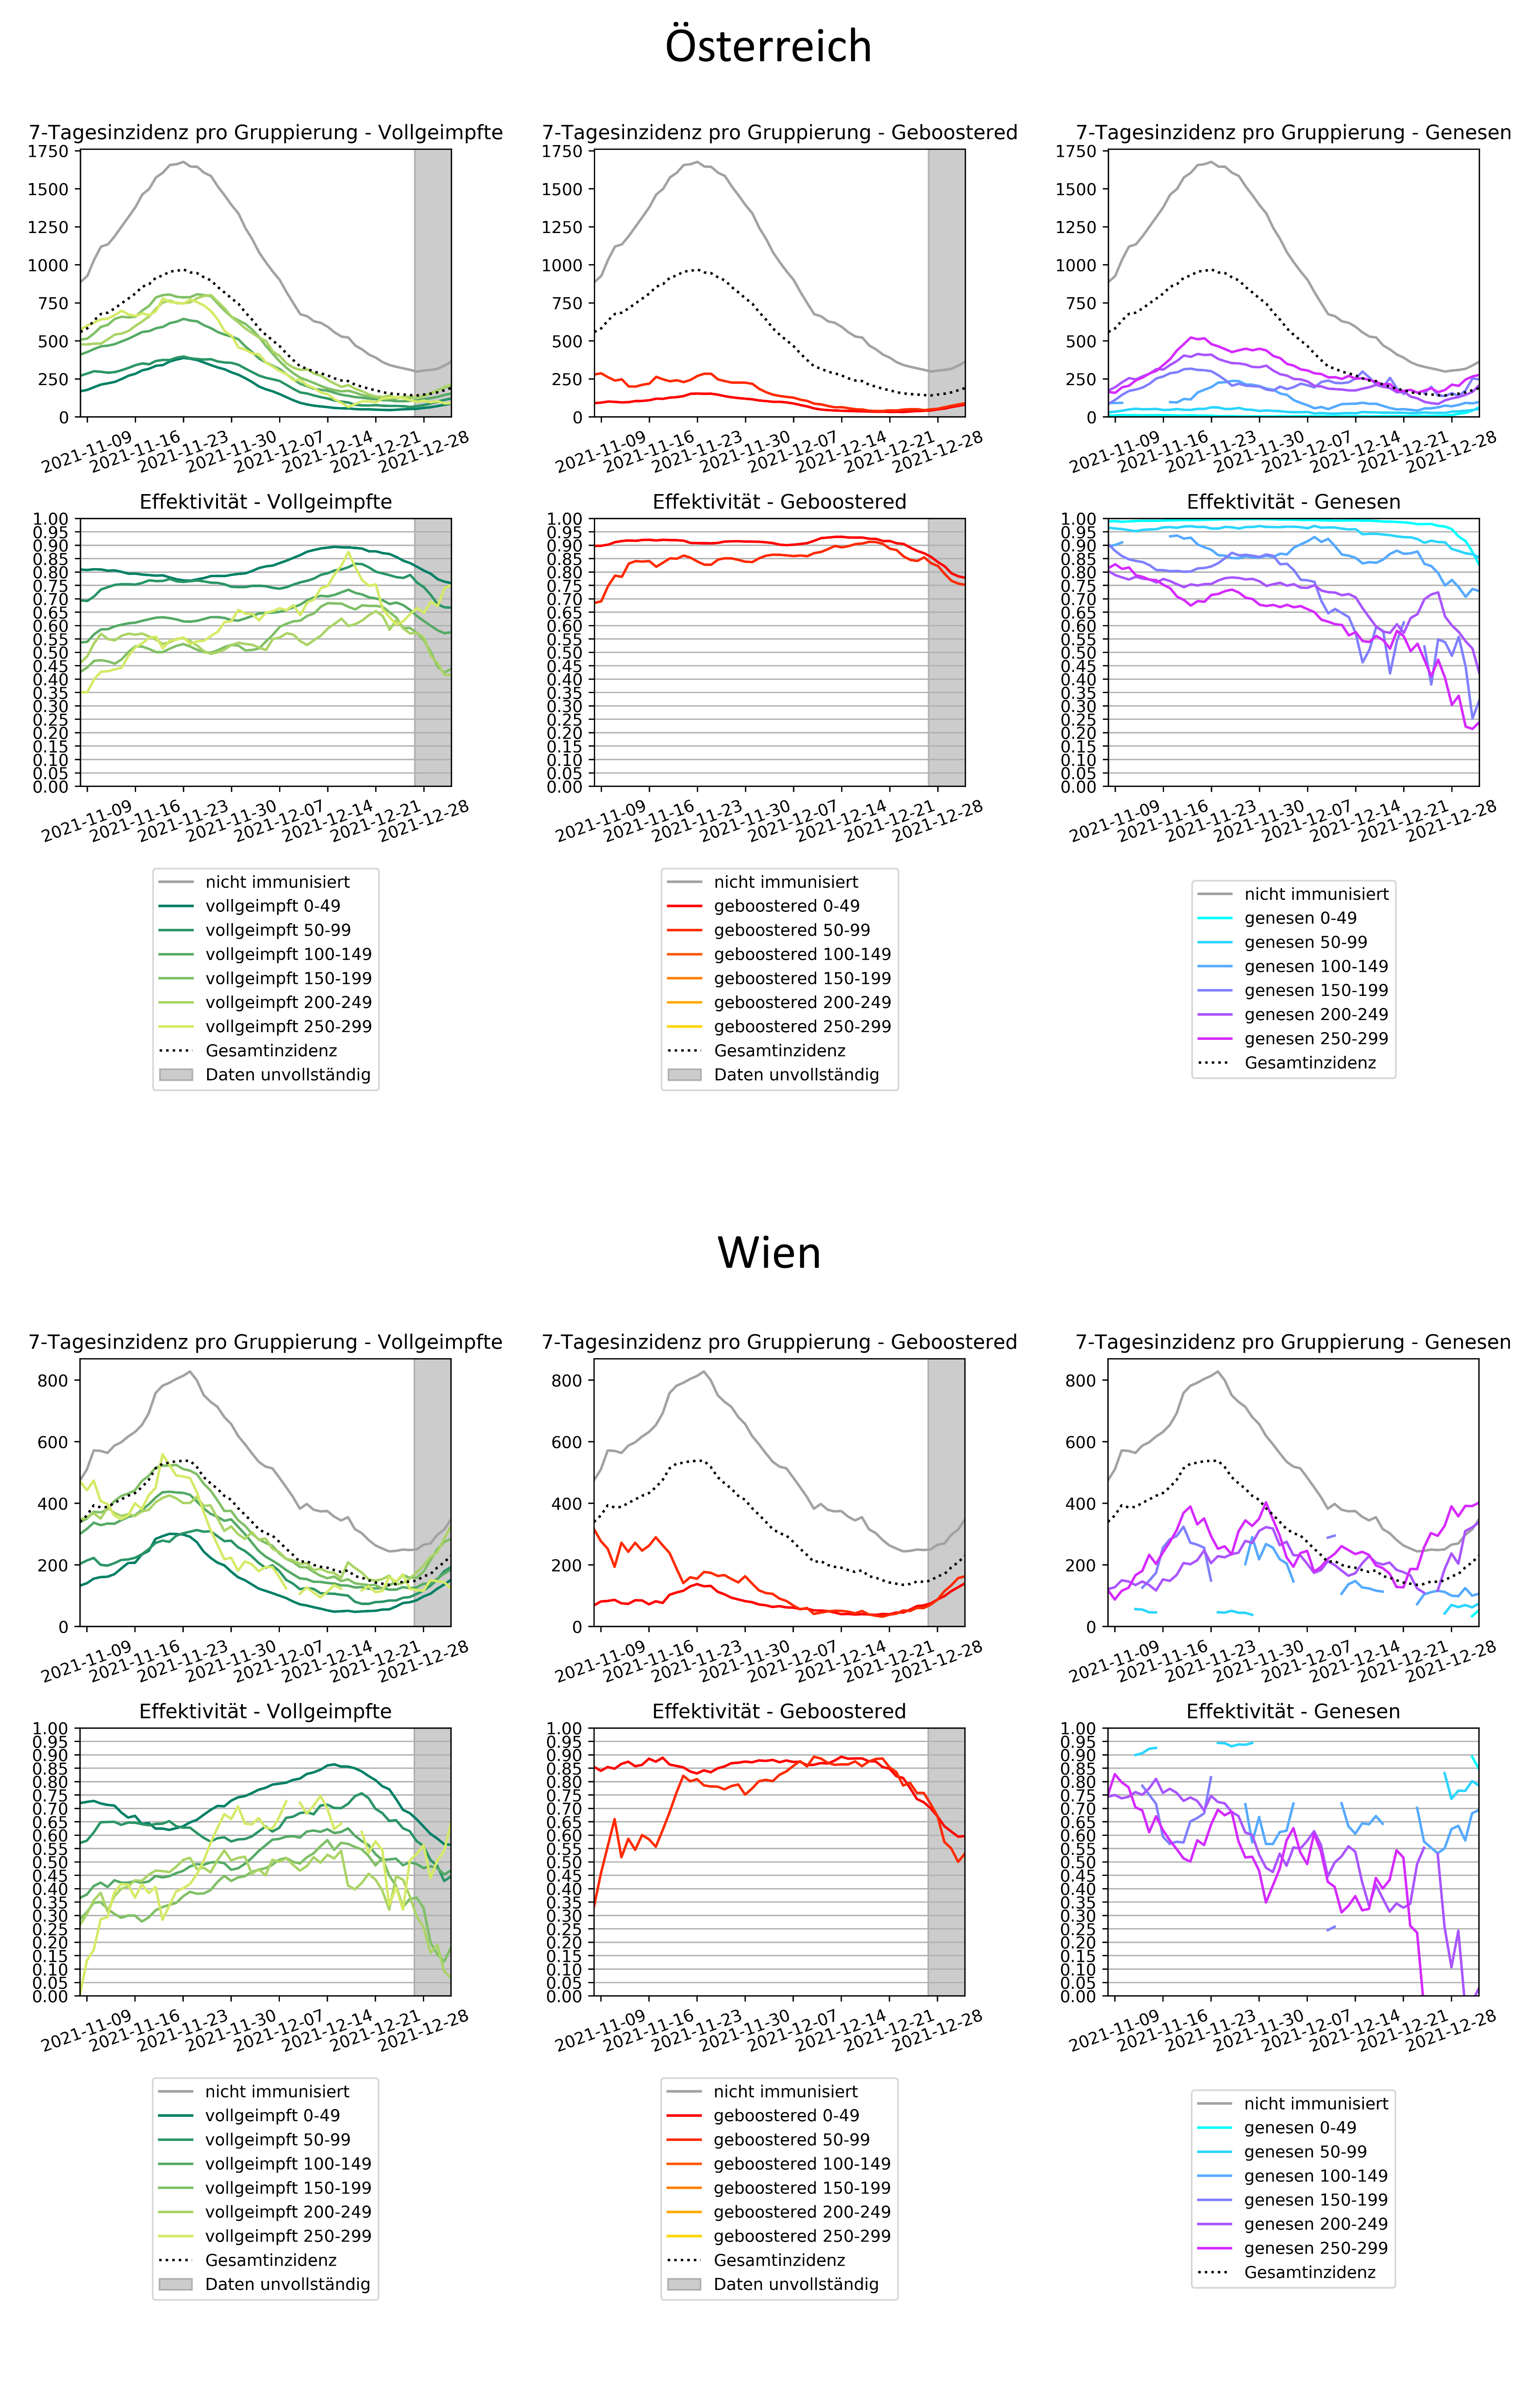
As always, an important aspect is that we continuously and as soon as possible compare the model assumptions with real data from Austria. This clearly takes a little time, but helps to make the virtual population model better and better. In Vienna, Omicron is now already more widespread than in other regions, and thus the “immunity-related” case numbers can provide information on how the situation is. One can see here even among the boostered that the protection against infection with the Omicron variant is obviously decreasing.
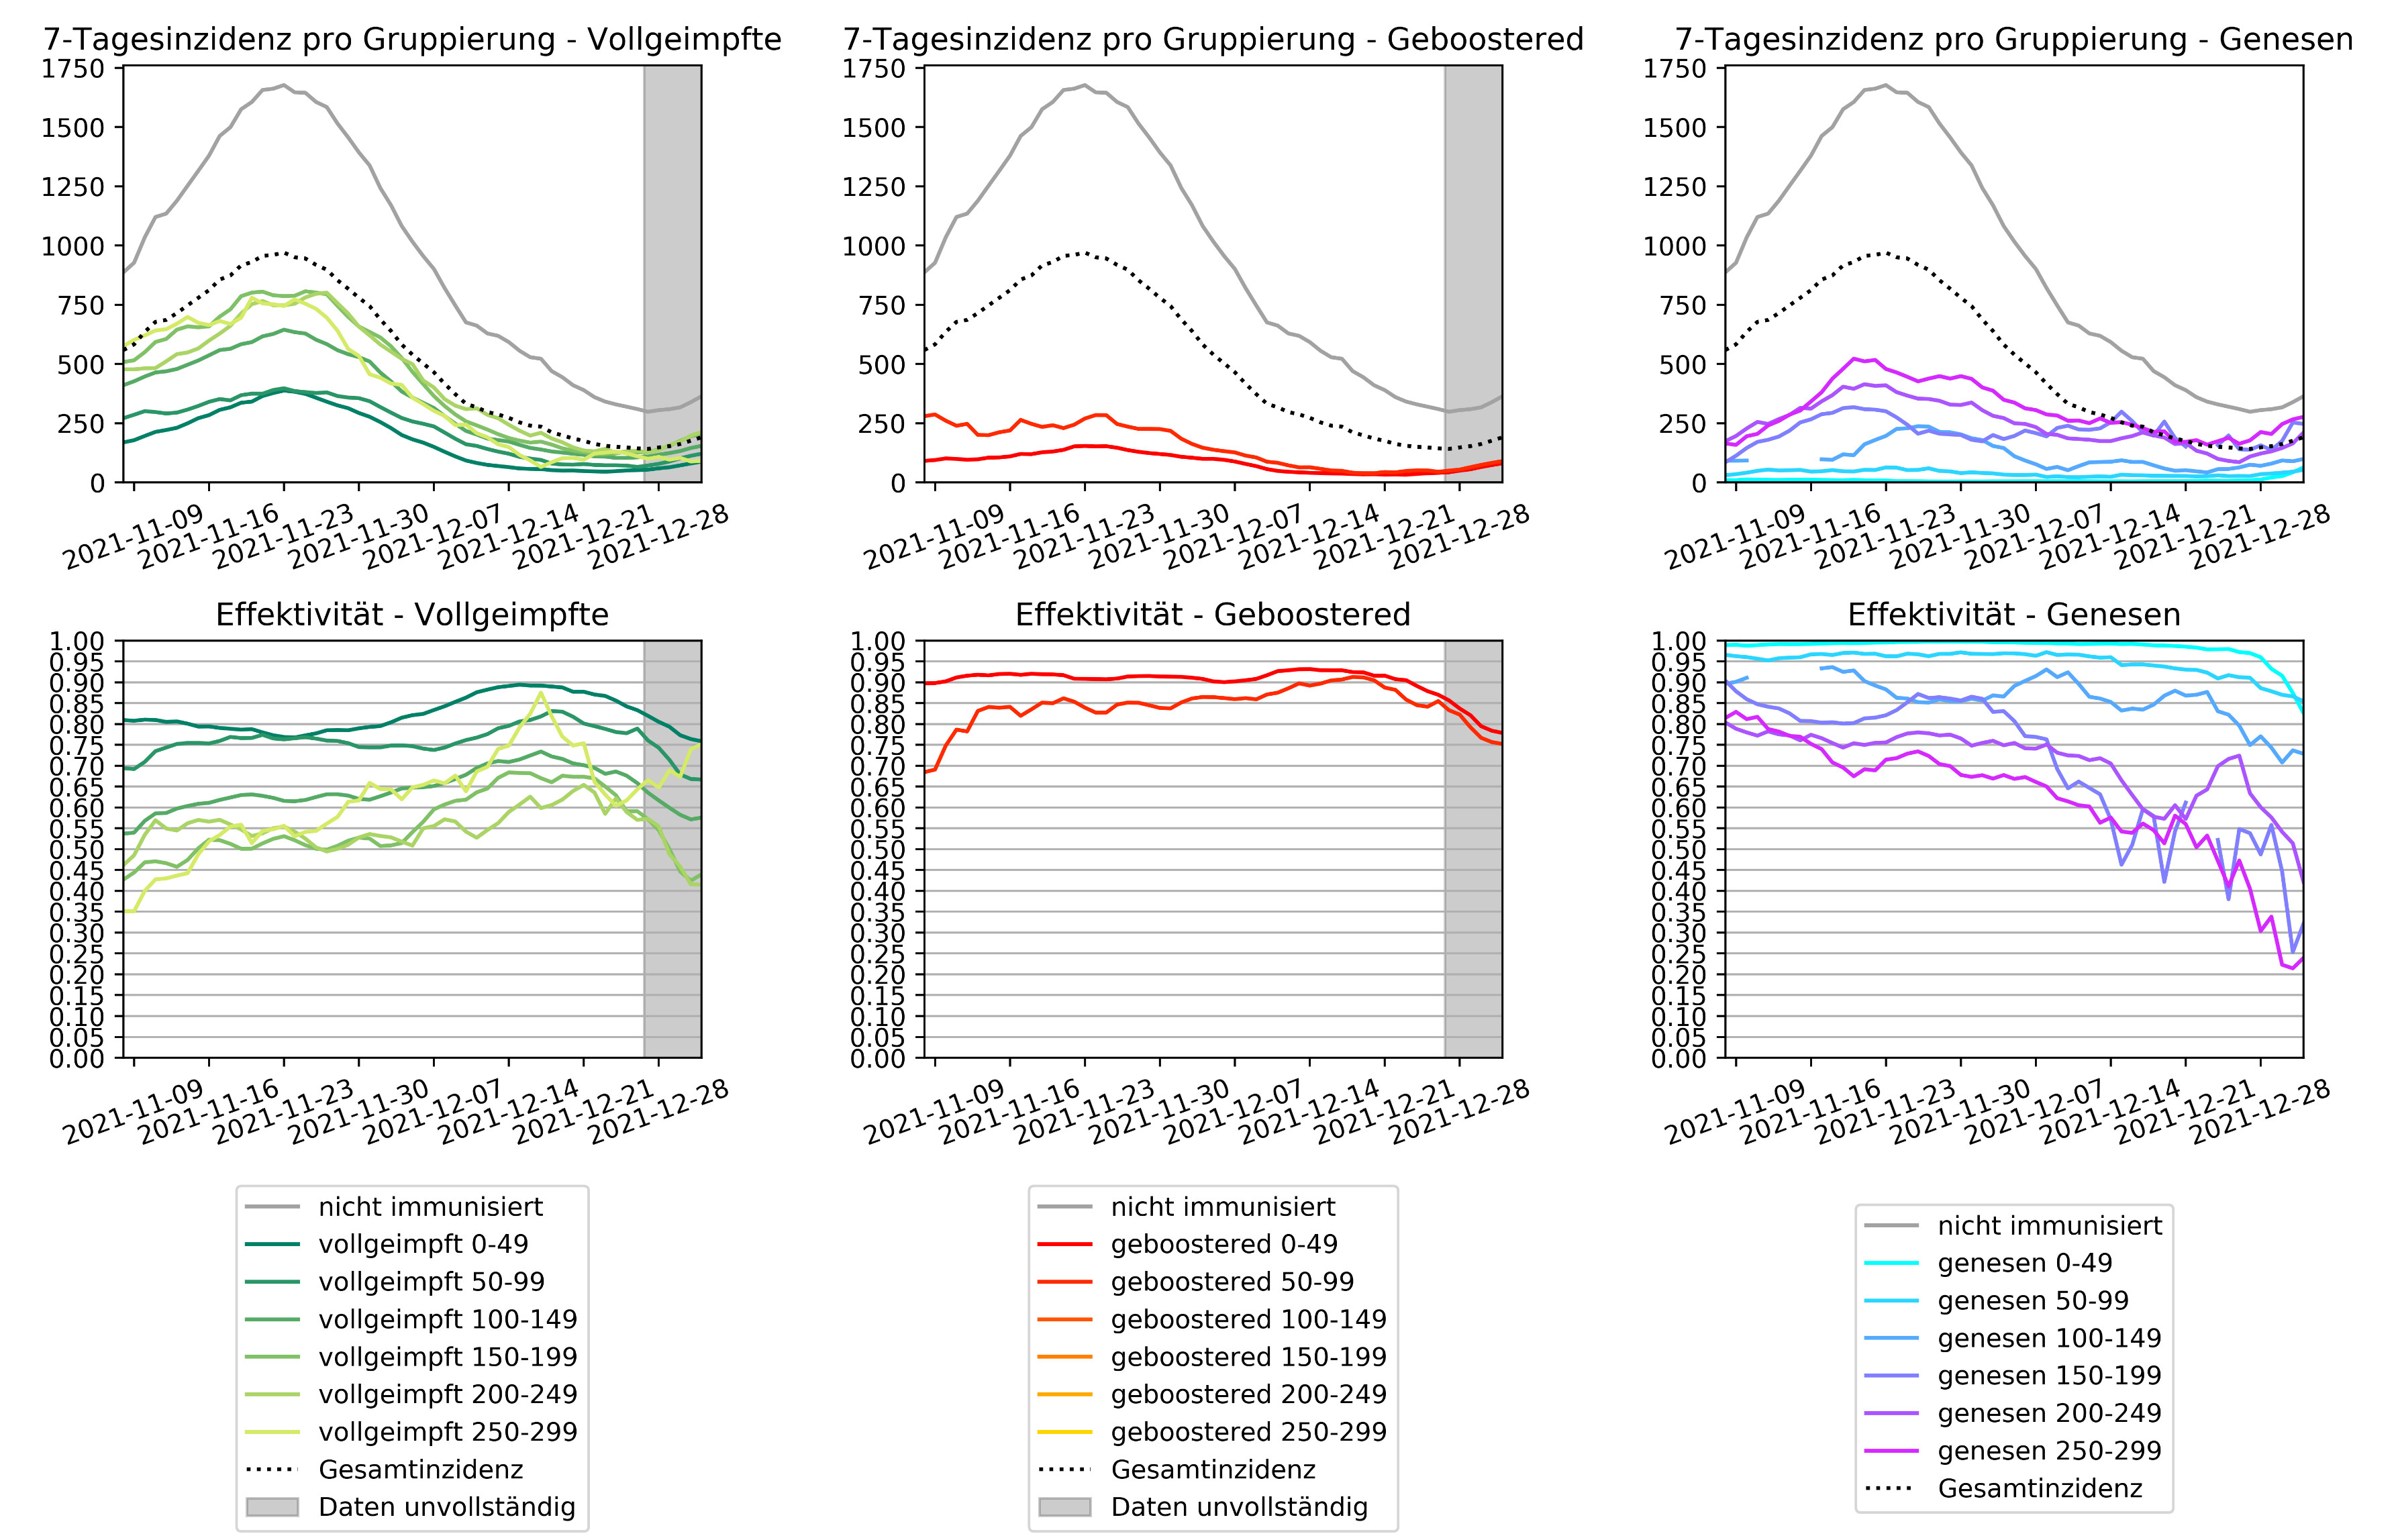 Figure 2: There is a decrease in vaccine protection with respect to infection due to the Omicron variant.
The (partial) loss of immunity against infection
Using the infection spread assumptions of Omicron, we also calculated an update to the model-based estimate of effective immunity to infection (i.e., actually to entry into the EMS). Here we see that about 90% of the population in Austria has already had “contact” with vaccination or virus. Against the delta variant, about 80% are protected against infection (as a result of vaccination activities and the November wave), against Omicron - resulting from the assumptions described above - it is unfortunately currently only about 55%. This corresponds approximately to the status in mid-August - i.e. directly before the last wave - when Omicron did not yet exist and Delta was predominant. This “immunity status” together with a more infectious and “faster” variant (lower serial interval) explains why the case numbers now show such a strong dynamic, but also why we are not back at the beginning.
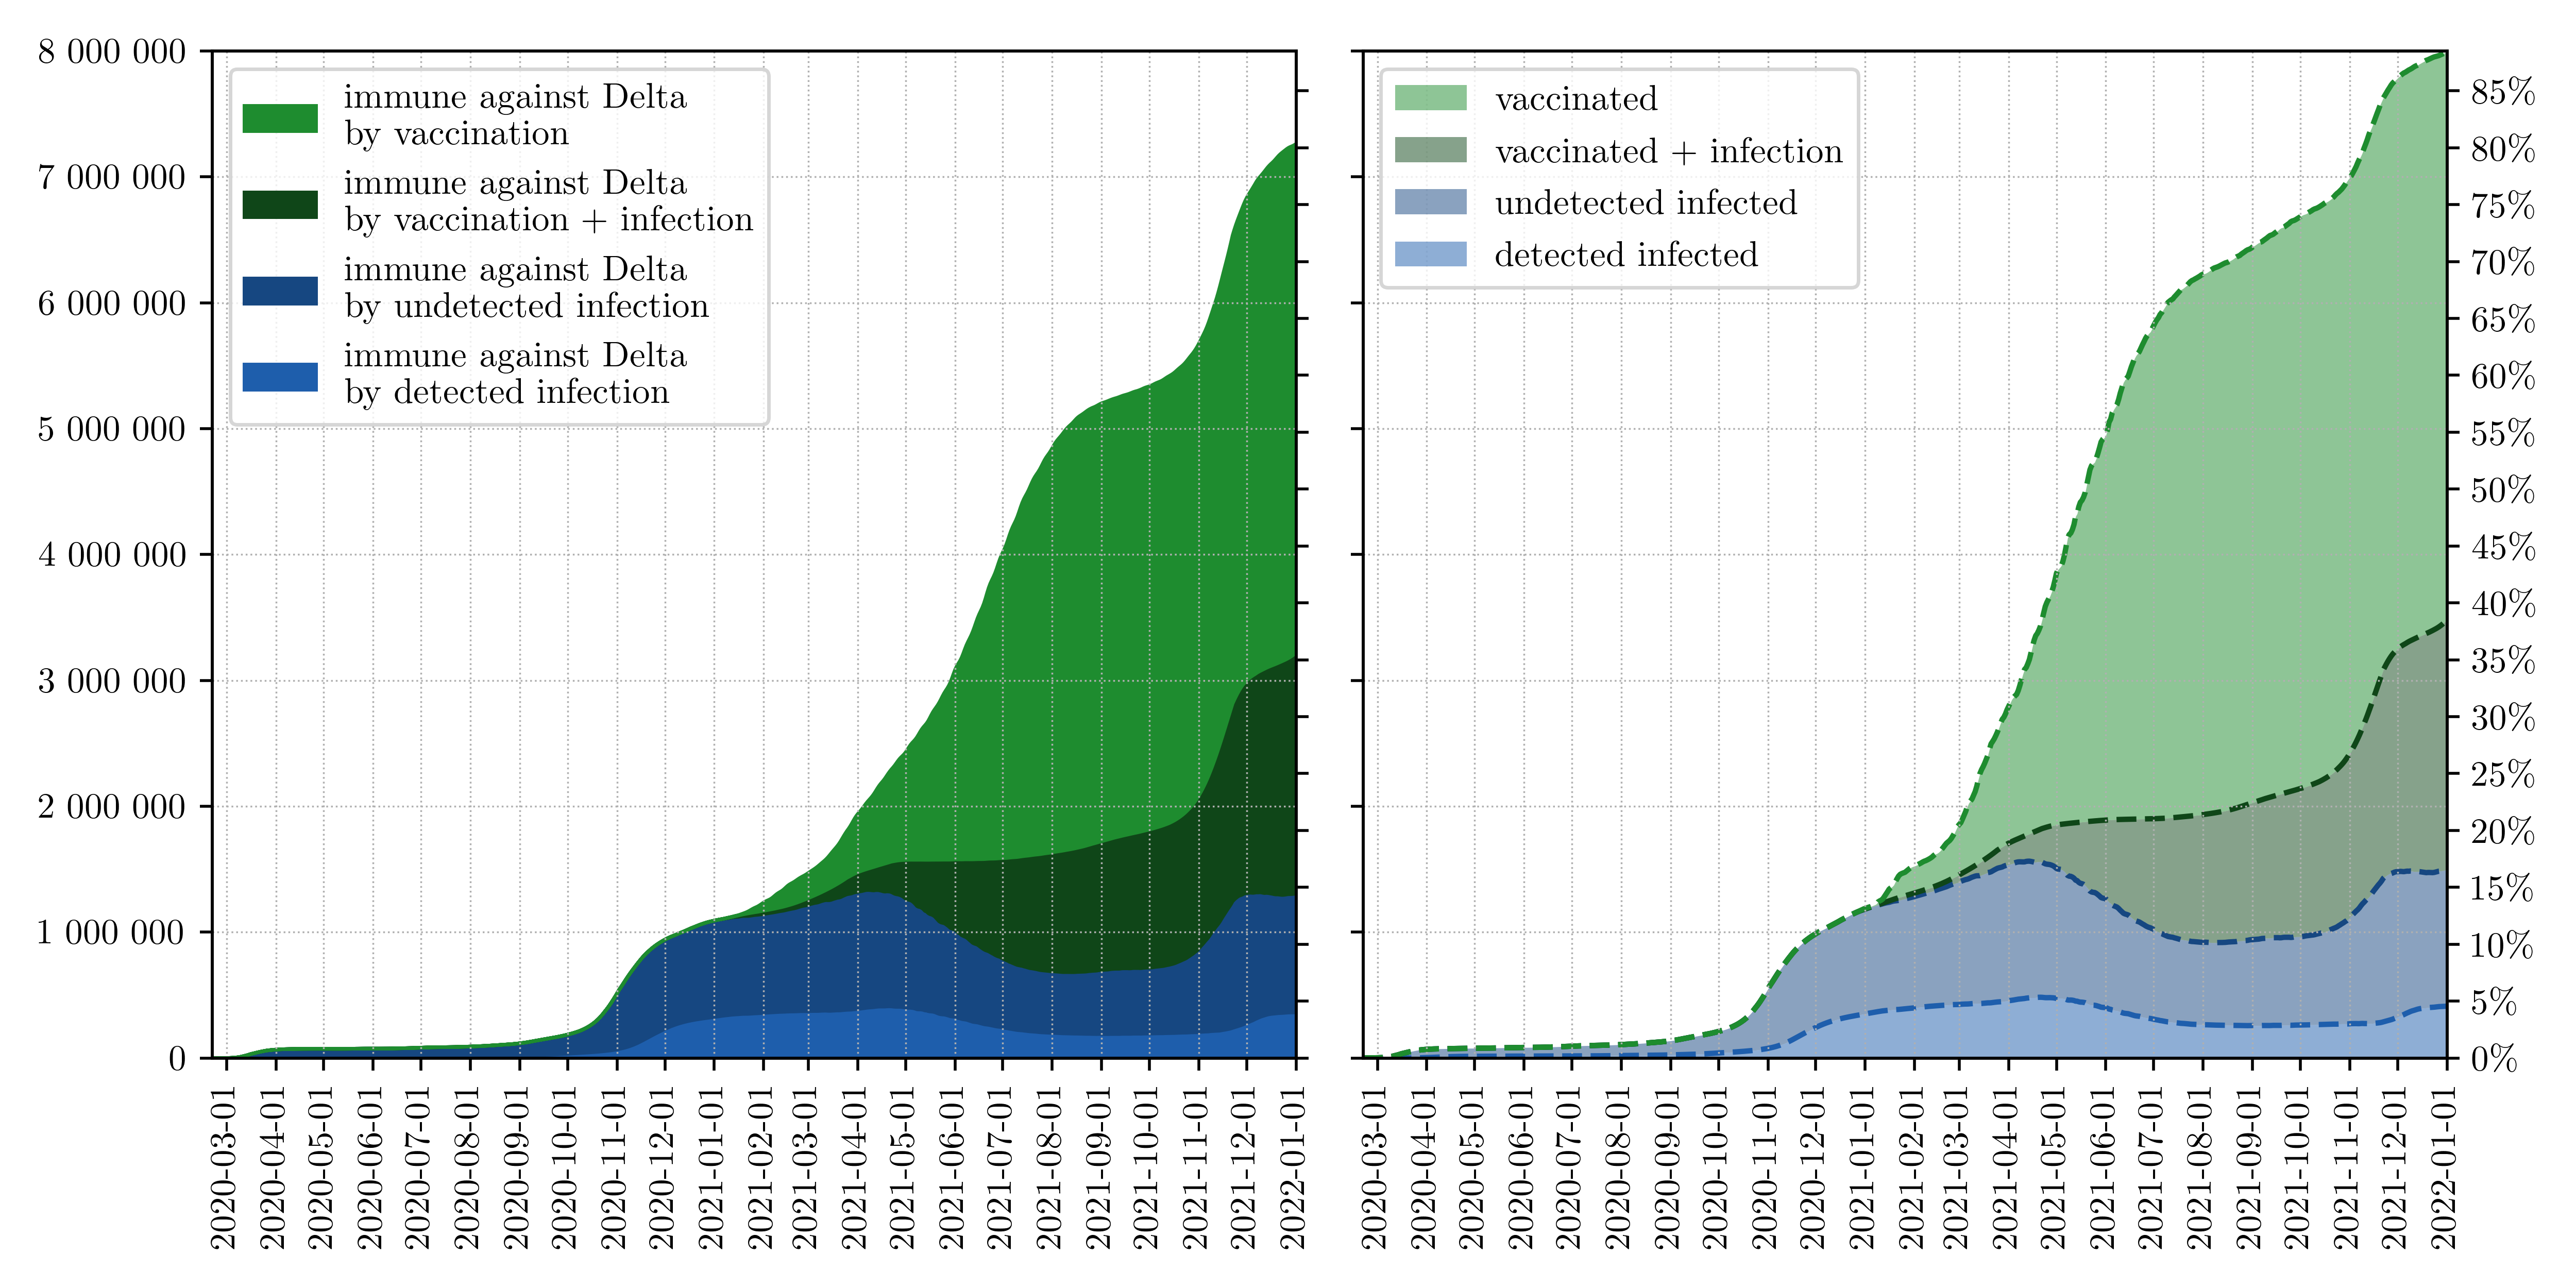 Figure 3, left: Effective immunization level of the population vs. Delta variant; right: cumulative number of recovered & vaccinated persons.
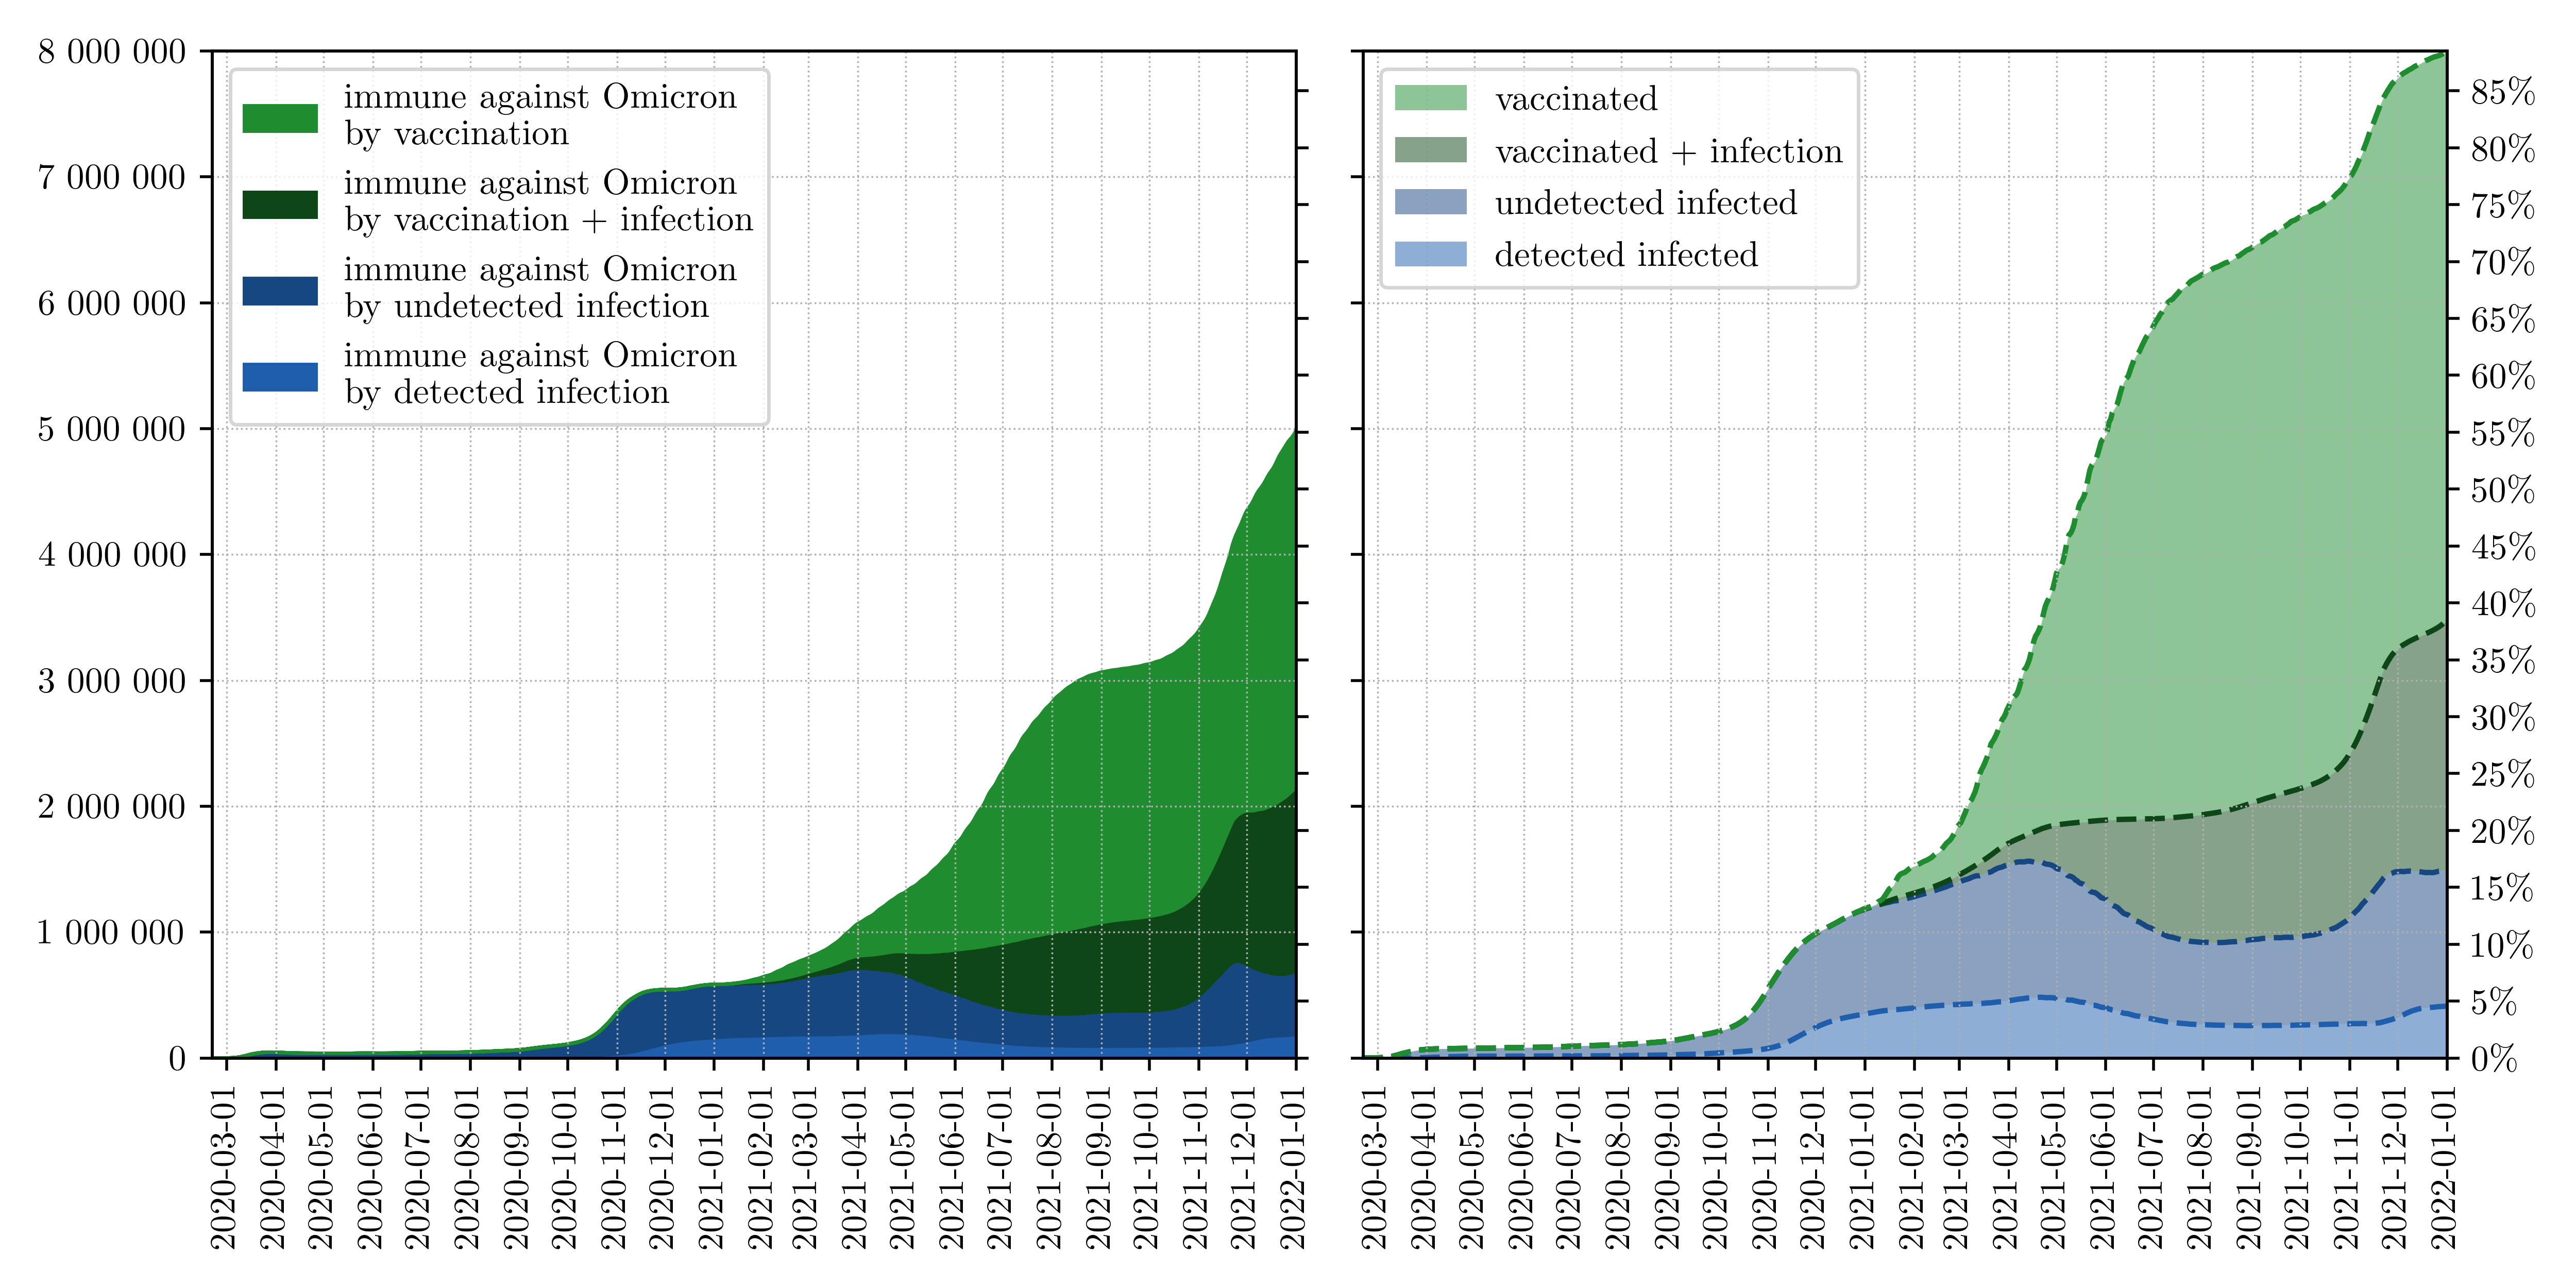 Figure 4, left: Effective immunization level of population vs. Omicron variant; right: cumulative number recovered & vaccinated.
Because even if the vaccination can do less against the spread dynamics of the new variant, the most important property of the vaccination remains: protection against severe disease progression. This is in fact far higher than that against infection, as can be seen in the studies and assumptions above.
What has to be considered…
In any case, due to the higher infectivity, the lower assumed serial interval (shorter incubation periods) and the described evasion of immune defenses, containment is more difficult and “breaking” the dynamics (without additional, supporting factors such as positive seasonality in spring) in the model can only be achieved with very strong measures. Therefore, growing case numbers can be expected if current (or similar) measures are maintained. This gives rise to various other issues.
Most important, of course, is the issue of the burden on ICU beds in particular and hospitals in general. This must also be seen in the context of medical care for other illnesses and emergencies, which have recently been limited. Currently, just under 15% of ICU beds are still occupied by COVID patients. Based on this starting point, it is necessary to closely monitor even a low increase.
Already at a utilization of more than 10%, there is a reduction in other health and care areas. Accordingly, even with conservative scenarios for the next few weeks, a combination of “dampening” the momentum and concrete support in the area of clinical care is reasonable and necessary. In addition, other aspects of health such as Long Covid need to be considered, which will require further studies and additional data.
However, Omicron is also changing the playing field. One example is the impact of quarantine rules. Here, scenarios compare different propagation sizes to determine which regulations allow critical infrastructure, for example, to be maintained. These scenarios do not represent forecasts. They are used to assess worst-case impacts and derive how to deal with them.
For the scenarios, we have assumed the impact of strict rules (such as those currently applied in Vienna) as a basis. We assume 14 days quarantine for confirmed positive cases, 80% test free after 10 days, and a 10-day quarantine for household members who do not become positive themselves. We assume a 1-day delay until notification of positive test. Free testing of symptomless K1 individuals in their own household is not possible after 5 days. We compared this setting with two relaxed settings:
- relaxed quarantine regime, with 10 days quarantine for confirmed positive cases, 80% free-testing after 5 days and free-testing after 5 days of symptomless K1 individuals.
- household quarantine where only persons who are in the same household are quarantined and they can freite test after 5 days.
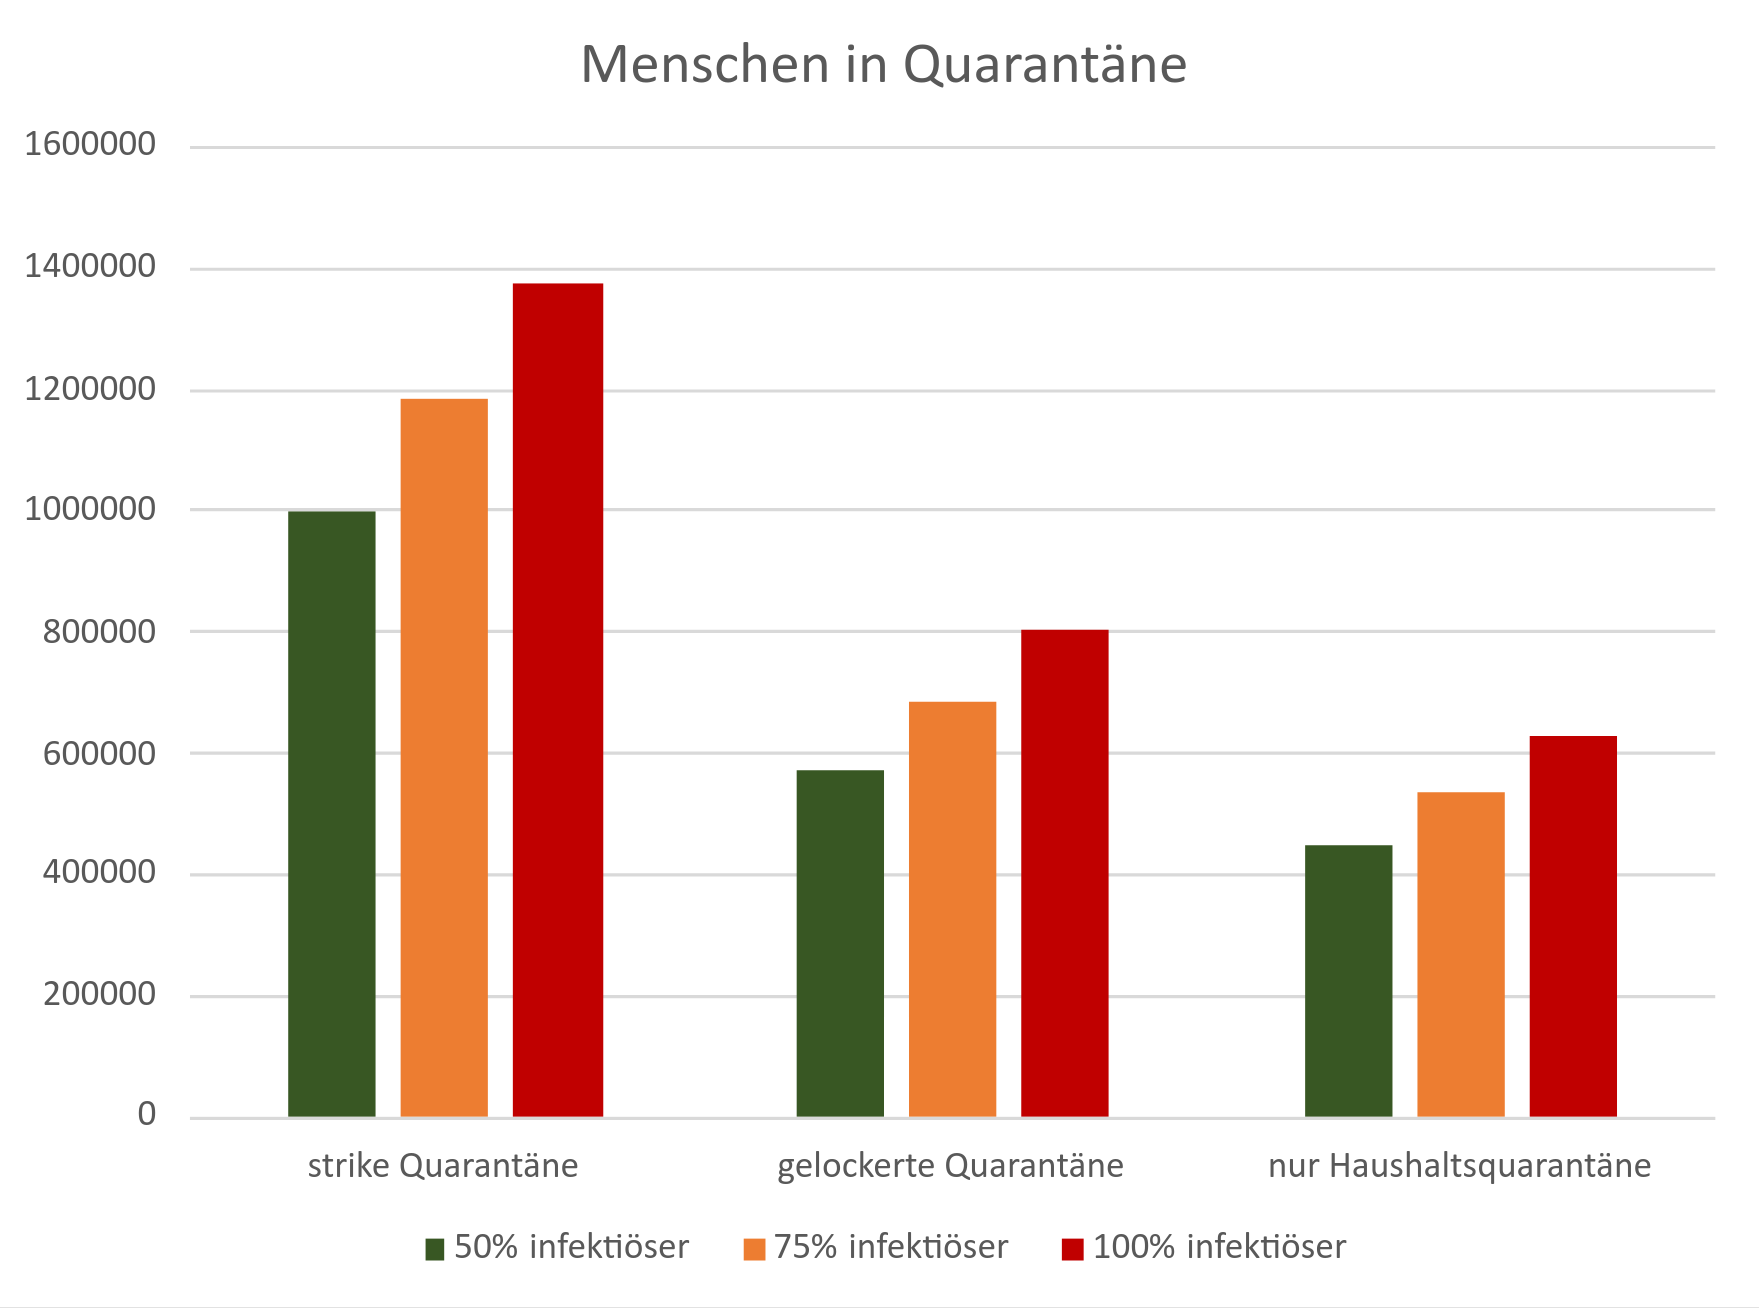 Figure 5: By changing the quarantine regulation, the number of people quarantined at the same time could be reduced by up to 55% (household-only quarantine).
Due to the characteristics of the Omicron variant, the model calculation results in very high case number peaks and correspondingly a high number of people who have a confirmed infection at the same time (Active Cases). The actual size of this “active cases peak” is very difficult to estimate, but is likely to be several hundred thousand people - forecasts are de facto impossible. In terms of decision support, however, another aspect of the scenario calculations is much more important: the potential to reduce the number of people under quarantine with looser measures.
The scenarios show that the number of “affected persons” can be reduced by more than half. With looser quarantine rules, there is a reduction of quarantined individuals by about 42% and with household-only quarantine by about 55%. But: with looser quarantine rules, again, there is less reduction in spread. These two effects must be weighed against each other when making decisions, and must be accompanied, for example, by a well-organized PCR screening strategy.
Current development and measures
Currently, a “moderating” strategy is chosen in pandemic management in Austria. The numbers will increase in the current setting. Therefore, many other aspects need to be considered in the context of this “paradigm shift”. On the one hand, the omicron wave requires clear communication about the status and outlook of the situation, as well as what can be achieved with which steps. The expectation - based on the data described above - is that the hospitalization rate will remain much lower than before. This needs to be monitored very closely. Nevertheless (or even more so), “judicious management” of caseloads is needed when deviating from the previous strategy.
It is more important than ever to create vaccination incentives and thus enable vaccination progress. In this way, diseases can be prevented and the number of severe cases can be further reduced - and the health care system can be spared. It is also a question of adapting the testing strategy. Not only to make the quarantine regulations practicable and safe, but also to prevent staff shortages, for example in system-relevant areas. But also to continue to protect “vulnerable” areas and people who cannot build up vaccination protection. This also requires, for example, the safe implementation of school and kindergarten operations with the support of (PCR) tests. For this, within the framework of the scientific networking of the Future Operations Platform, a recommendation is currently in progress, which will be published at the end of the week.
Further, possible effects of Long COVID or other aspects that have not been in focus so far need to be considered. Last but not least, it is necessary to adapt processes in the health care system and to establish a close monitoring in order to reduce the intensive care unit utilization with Covid-19 patients below ten percent and then to keep it there. In this way, postponed therapies can be made possible again and return to the necessary “regular operation”.